
B2B Content Marketing ROI

Stop guessing if your content is working. Learn how to accurately measure B2B content marketing ROI, calculate attribution, and track revenue-driving metrics. Let’s address the elephant in the room: measuring the exact return on investment (ROI) of B2B content marketing is incredibly frustrating. If you’ve ever worked in marketing leadership, you know the drill. You’re cornered by a CFO demanding to know exactly how much revenue last month’s blog posts, case studies, or whitepapers brought in. If your answer is a vague list of vanity metrics like page views, social shares, or organic keyword rankings, you can practically watch their eyes glaze over. In the real business world, likes don’t buy budget. Revenue does. The corporate reality is harsh but simple: when budgets get tight, content is usually the first thing on the chopping block if you cannot link creative output directly to the sales pipeline. Yet, content remains the primary engine driving modern buying journeys. Buyers gather information in the shadows, consuming your articles and downloading your guides long before they ever raise their hand to speak to a sales representative. If you cannot track this invisible journey, you are essentially driving your marketing strategy in pitch-black darkness. This practical guide skips the marketing fluff. Instead, we are diving into a finance-approved, common-sense framework to calculate, track, and scale your B2B content marketing ROI.
Why Measuring Content ROI is a Unique B2B Challenge
Measuring ROI for a simple direct-response ad campaign is easy. A user clicks an ad, lands on a product page, buys a product for ₹5,000, and you instantly know your customer acquisition cost (CAC) and return on ad spend (ROAS). B2B content marketing operates in a completely different universe.
The Complex B2B Buying Ecosystem

A typical enterprise B2B deal takes anywhere from 3 to 9 months to close. A piece of content read in January might not yield a single rupee of revenue until October.
You aren’t marketing to a single impulsive shopper. You are marketing to a committee of 6 to 10 stakeholders—including daily users, IT security leads, finance heads, and VPs. One person might read your technical blog, while another reviews your security whitepaper.
A single buyer will likely interact with your brand 15 to 20 times across multiple channels (organic search, LinkedIn, newsletters, webinars) before conversion. Isolating the financial impact of a single blog post is near impossible without the right framework. Because of this complexity, traditional attribution models usually fail. To prove true value, you must stop treating content as a series of isolated articles and start looking at it as an integrated financial funnel.
The Core Financial Formula for Content Marketing ROI
Before diving into complex tracking setups, you must ground your analysis in basic financial logic. At its absolute foundation, ROI is a calculation of net profit relative to your total investment. The standard mathematical formula for calculating content marketing ROI To apply this formula accurately without getting pushback from finance, you must break down both variables with clinical precision.
Variable A: Total Content Investment (The Real Costs)
Do not make the rookie mistake of only counting external freelance writing invoices. Your true cost basis must include:
Internal employee salaries scaled by the exact percentage of time they spend on content strategy, writing, editing, and distribution.
Direct fees paid to freelance writers, graphic designers, video editors, and agency partners.
Variable B: Financial Return from Content (The Revenue)
This is where alignment with your sales and finance teams is vital. You must establish clear definitions for: First-Touch Revenue: The total contract value generated from a customer whose very first interaction with your brand was a specific piece of content. Multi-Touch / Influenced Revenue: The total value of deals that engaged with your content assets at any point during their active buying cycle.
The Three Phases of Content ROI Maturity
You cannot jump from tracking basic website page views straight to advanced, multi-touch algorithmic attribution overnight. Trying to build an enterprise-grade measurement system immediately usually results in data paralysis. Instead, scale your measurement strategy across three distinct phases of operational maturity:
Tracks Traffic, Time on Page, Bounce Rates, and Keyword Rankings using Google Analytics 4 and Google Search Console to validate target audience engagement and content quality.
Tracks Form Submissions, Lead Magnet Downloads, MQLs, and SQLs using HubSpot, Marketo, and basic CRM triggers to bridge the gap between reading content and creating pipeline.
Tracks Customer Acquisition Cost (CAC), Customer Lifetime Value (LTV), and Influenced Pipeline Value using Salesforce and advanced attribution software to map content consumption directly to closed-won deals and revenue.
Phase 1: Operational & Engagement Metrics (The Foundation)
Operational metrics are leading indicators. While they do not directly prove revenue, they tell you whether your target audience actually cares about what you are publishing. If your time-on-page is under 30 seconds and your bounce rate is over 80%, your content isn’t high enough quality to drive downstream financial conversions.
Phase 2: Pipeline Metrics (The Bridge)
This phase connects content consumption to active business lead generation. Here, you track Marketing Qualified Leads (MQLs)—users who transition from casual readers into known prospects by exchanging their business email for a high-value content asset like a whitepaper, proprietary data report, or template tool
Phase 3: Revenue Metrics (The Goal)
This is the ultimate stage of marketing maturity. Here, your content analytics platform is fully integrated with your CRM (like Salesforce). You can see that a specific enterprise account read four blog posts, downloaded a case study, and later closed as a high-value deal.
A Simple Step-by-Step Implementation Strategy
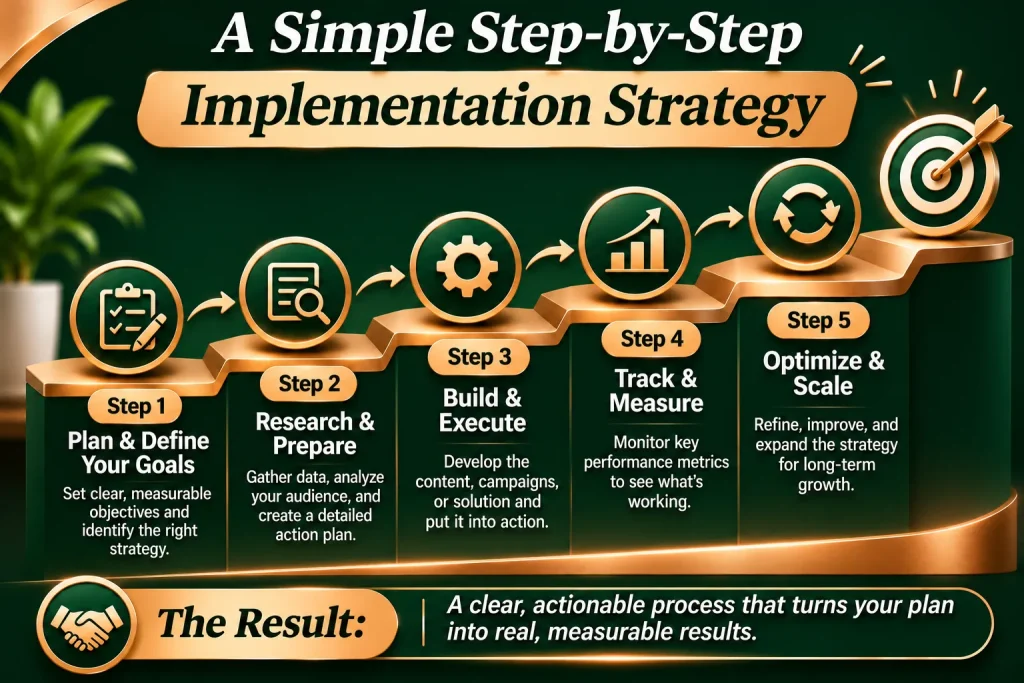
If you want to transition your marketing department into a data-driven revenue engine, execute this practical implementation plan.
• Implement Dynamic UTM Parameter Standards: Never publish or distribute a piece of content without strict UTM tracking parameters attached to its links. Standardise your source, medium, and campaign names across the entire organization.
• Establish Defined Gated Content Milestones: Create high-value, proprietary assets that justify a user filling out a lead form. Ensure your forms capture clean data (company size, job role) so you can cross-reference lead quality against your Ideal Customer Profile (ICP).
• Configure Pipeline Stages inside Your CRM: Ensure your sales team actively logs when a deal moves from a raw lead to a Sales Qualified Lead (SQL), an active opportunity, and ultimately to a closed-won customer. Ensure your marketing automation tool passes all web interaction histories straight into the CRM timeline for sales reps to see.
Hidden Costs and Nuances Most Marketers Overlook
Calculating true ROI requires absolute financial transparency. If you present incomplete calculations to your leadership team, you risk losing strategic credibility. Watch out for these two factors:
Unlike paid advertising, which stops generating traffic the exact second you turn off your daily budget, high-quality content is a compounding asset. A deeply researched, SEO-optimized guide published two years ago can continue to rank on search engines, pull in high-intent organic traffic, and generate fresh business leads today without requiring an additional rupee of production spend. When calculating long-term ROI, factor in this compounding efficiency factor.
A significant portion of your content’s true impact happens in spaces analytics tools cannot track—internal Slack channels, private WhatsApp groups, podcasts, and word-of-mouth recommendations. This is known as Dark Social. To capture this hidden attribution value, add a simple, mandatory, non-templated text field to your demo request forms asking: “How did you first hear about us?” The manual text responses will frequently reveal that buyers have been quietly reading your blog content for months based on a peer’s recommendation.
Ready
Frequently Asked Questions

Because B2B industries vary wildly in deal size and profit margins, there is no single universal percentage benchmark. However, a mature, optimized B2B content program typically aims for a 3:1 to 5:1 ratio—meaning every ₹1,000 invested should generate ₹3,000 to ₹5,000 in provable pipeline revenue over a 12-month trailing horizon.
Even if a blog post does not feature a lead form, you can track its financial impact by setting up custom scroll-depth and click-based destination goals in your analytics dashboard. Track how many users read an ungated blog post and subsequently navigate to high-intent internal pages, such as your product features, pricing, or demo booking pages.
Avoid bombarding executive leadership with granular weekly data updates. Operational and engagement metrics should be reviewed internally by the marketing team every month. However, formal pipeline impact and revenue attribution reports should be delivered quarterly or semi-annually to match the natural timeline of your B2B sales cycle.